It’s no surprise that car accidents are quite common throughout Metro Vancouver, so ICBC has revealed exactly where they’re happening the most with their collision data maps. Using data as of March 31, 2025, these maps show an array of crash types, as well as when and where they occurred.
ICBC and Car Accidents
These maps are from ICBC’s interactive crash maps, which are broken down into the Lower Mainland, Vancouver Island, Southern Interior, and North Central. They also have other maps that involve cyclists, pedestrians, and motorcycles.
The statistics do come with a few notes, including the fact that the maps only include crashes that included sufficient location information to determine a latitude and longitude. Moreover, “crash location information is self reported and not always verifiable.”
Still, the maps reveal much about where and when crashes in the Lower Mainland have most often happened throughout the years.
Lower Mainland Crash Maps
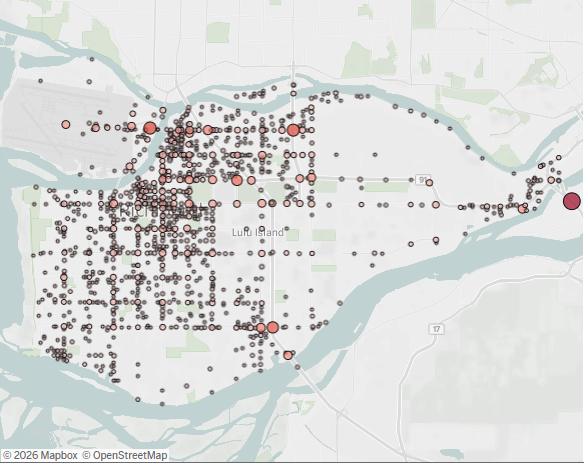
Photo: ICBC
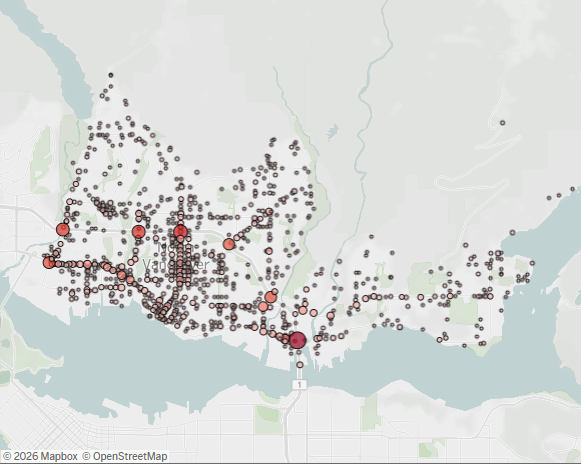
Photo: ICBC
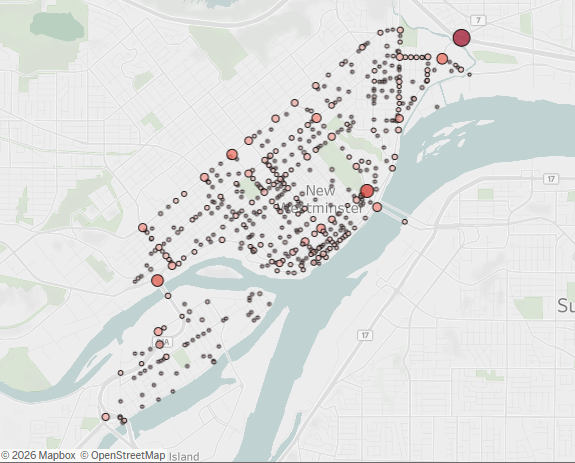
Photo: ICBC
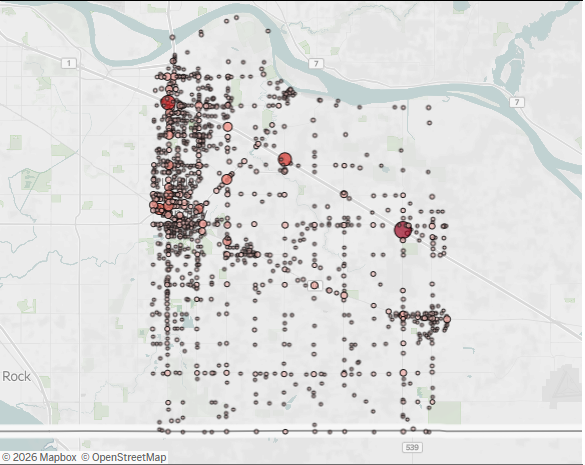
Photo: ICBC
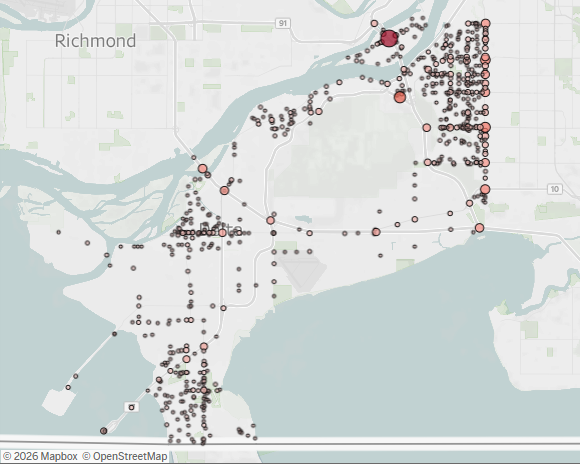
Photo: ICBC
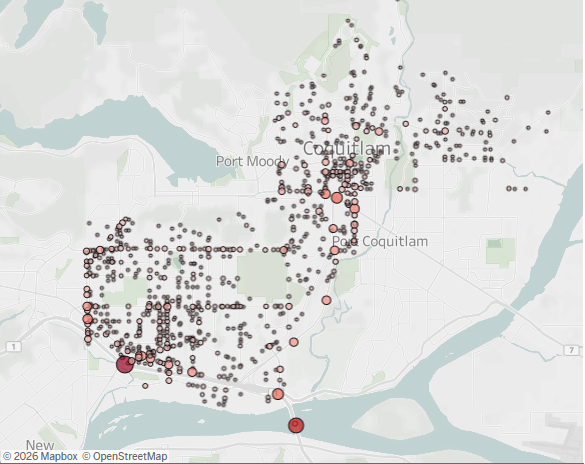
Photo: ICBC
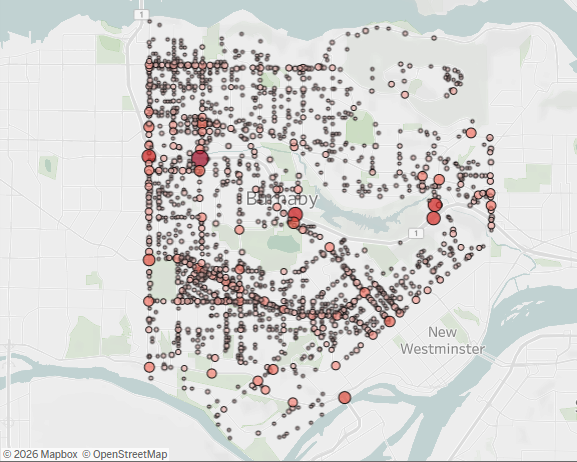
Photo: ICBC
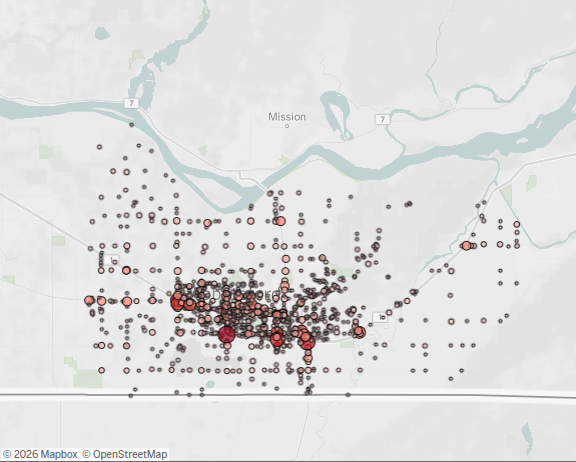
Photo: ICBC
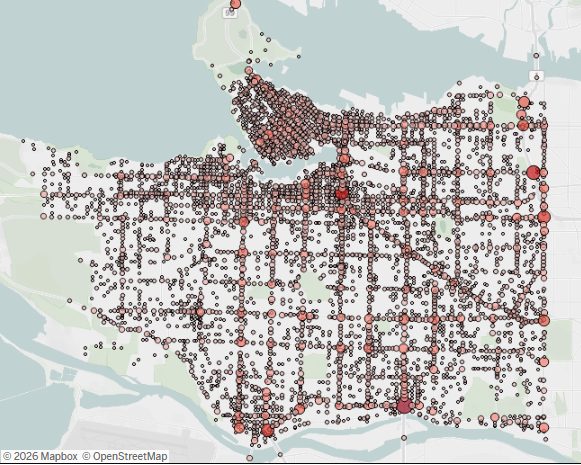
Photo: ICBC
Curious about more ICBC information? They have a statistics and data page that you can check out right here. You can find their interactive maps there, as well.
You might also like